
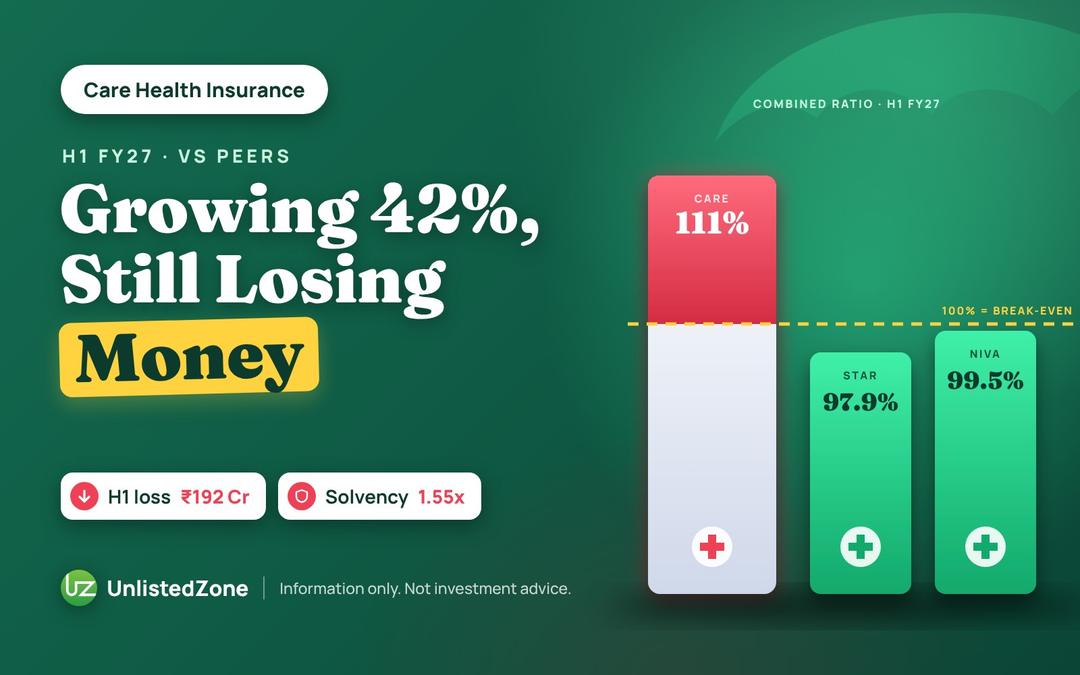
In today's story, we look at how Care Health Insurance sold 42% more insurance in six months and still ended up ₹192 crore in the loss.
Imagine you run a gym. This year, memberships are flying off the shelf and collections are up 42%. You should be celebrating.
But when your accountant closes the books, you've made a loss. A bigger one than you have seen in years.
That is roughly what happened at Care Health Insurance between April and September 2026, the first half of FY27. Gross premiums jumped from ₹4,354 crore to ₹6,193 crore. Yet a ₹18 crore profit a year ago turned into a ₹192 crore loss.
So what's going on?
Every insurer's story starts with one number: gross written premium, or GWP. It is the total value of policies sold in a period. Think of it as the insurer's sales.
Here is how Care's sales have moved, quarter by quarter.
GWP (₹ crore) | FY26 | FY27 | Growth |
|---|---|---|---|
| Q1 (Apr–Jun) | 2,049 | 2,927 | +43% |
| Q2 (Jul–Sep) | 2,305 | 3,266 | +42% |
| First half | 4,354 | 6,193 | +42% |
That is about ₹1,840 crore of extra premium in just six months. And both quarters grew at the same pace, so this was not a one-off.
Sales are only half the story. What matters is how much of that premium goes back out.
An insurer has three big costs. Claims paid to customers. Commission paid to agents and brokers. And operating expenses, which is salaries, rent, technology and advertising.
Here is Care's split in ₹ crore, with the percentage of GWP alongside.
₹ crore (% of GWP) | Q1 FY26 | Q2 FY26 | Q1 FY27 | Q2 FY27 |
|---|---|---|---|---|
| GWP | 2,049 | 2,305 | 2,927 | 3,266 |
| Claims | 1,541 (75.2%) | 1,664 (72.2%) | 2,023 (69.1%) | 2,058 (63.0%) |
| Commission | 422 (20.6%) | 507 (22.0%) | 561 (19.2%) | 672 (20.6%) |
| Operating expenses | 272 (13.3%) | 301 (13.1%) | 411 (14.0%) | 430 (13.2%) |
| Total | 2,235 (109.1%) | 2,472 (107.3%) | 2,995 (102.3%) | 3,160 (96.8%) |
| Premium passed to reinsurers | 485 (23.7%) | 662 (28.7%) | 708 (24.2%) | 1,079 (33.0%) |
A year ago, these three costs added up to 109% of GWP. By the September 2026 quarter, they were down to 97%.
Commission and operating expenses have barely moved. Together they take 33% to 35% of GWP in every quarter. The whole improvement has come from claims.
And then there is reinsurance
Look at the last row. Care does not keep all the premium it sells. It passes a part to reinsurers, who take a share of the risk in return.
That share is rising. Care passed on 28.9% of its GWP in the first half, up from 26.3% a year ago. In the September quarter alone, it was 33%.
Reinsurance is not a pure cost. Reinsurers pay their share of claims, and they paid Care ₹448 crore of commission in the half. After both, we estimate reinsurance cost Care about ₹252 crore, or 4% of GWP, up from about 2% last year.
Add that in, and Care's total outgo for the first half comes to roughly ₹6,405 crore, or 103.4% of GWP.
One caution. Claims come from policies sold earlier. When sales jump 42%, claims look small against them. The real test is whether the claims percentage stays low once growth cools.
Claims here are before reinsurance and are our estimate. Care discloses claims incurred net of reinsurance, which we have scaled up using its ratio of gross to net claims paid. The net cost of reinsurance is derived from the same estimate.
Numbers mean little in isolation. So let's run the same test on the two listed pure health insurers, Star Health and Niva Bupa.
First half of FY27, ₹ crore (% of GWP) | Care Health | Star Health | Niva Bupa |
|---|---|---|---|
| GWP | 6,193 | 9,562 | 4,634 |
| GWP growth | 42% | 19% | 33% |
| Claims | 4,079 (65.9%) | 6,817 (71.3%) | 2,955 (63.8%) |
| Commission and acquisition cost | 1,233 (19.9%) | 2,302 (24.1%) | 1,371 (29.6%) |
| Operating and other expenses | 841 (13.6%) | 573 (6.0%) | 253 (5.5%) |
| Net cost of reinsurance | 252 (4.1%) | 42 (0.4%) | 84 (1.8%) |
| Total | 6,405 (103.4%) | 9,734 (101.8%) | 4,662 (100.6%) |
Three things jump out.
Care is the fastest grower. It is growing at more than twice Star's pace, and it is now about two-thirds of Star's size.
Each one has a different weak spot. Star runs the leanest shop, with commission and expenses at about 30% of GWP, but pays the most in claims. Niva pays the least in claims but spends the most to win customers, about 35%. Care sits in the middle on both, at about 33.5%.
Care leans the most on reinsurance. Before reinsurance, Care's total of 99.4% sits between Star and Niva. After it, Care is the highest of the three at 103.4%, though the gap is under three percentage points. A year ago, all three were between 108% and 110%.
A note on the table: the commission and expense rows are not a perfect match across companies. The listed players club more items into acquisition cost. The total row is the fairer comparison.
One more gap is worth noting. Niva's solvency ratio is 2.03x. Care's is 1.55x, just above the 1.5x minimum.
Look at the totals again. All three companies spend more than 100% of their GWP. Yet Star reported a profit of ₹815 crore for the half and Niva ₹273 crore, while Care lost ₹192 crore.
How? There are two reasons.
1. Profit is not measured against GWP
GWP is premium sold. Profit is worked out on premium earned, month by month.
Star and Niva present their numbers under the newer Ind AS format. It also spreads the cost of acquiring a customer over the life of the policy. On that basis, their combined ratios are just under 100%. Star is at 97.9% and Niva at 99.5%.
Care's public disclosure follows the older format, where commission hits upfront. Care sold ₹6,193 crore in the half but could book only ₹3,991 crore as earned, after reinsurance. Its combined ratio came to 111%.
2. Investment income does the heavy lifting
First half of FY27, ₹ crore | Care Health | Star Health | Niva Bupa |
|---|---|---|---|
| Underwriting result | (659) | 210 | 27 |
| Investment income | 425 | 911 | 357 |
| Profit / (loss) before tax | (255) | 1,093 | 365 |
| Profit / (loss) after tax | (192) | 815 | 273 |
See the pattern? Star and Niva barely make money from insurance itself. Almost all of Niva's pre-tax profit, ₹357 crore out of ₹365 crore, is investment income. For Star it is ₹911 crore out of ₹1,093 crore, and that includes ₹229 crore of mark-to-market gains.
Care earns investment income too. But its underwriting loss is bigger than what its investments bring in.
So the listed players are not running a cheaper business. They are close to break-even on insurance and let the investment book deliver the profit. Which brings us to Care's own investment book.
All the premium collected upfront has to sit somewhere until claims arrive. On 30 September 2026, Care was sitting on investments of ₹12,897 crore. A year ago it was ₹9,498 crore.
Of this, ₹10,382 crore is policyholders' money, up 49%. The owners' own funds are ₹2,515 crore, almost flat. So the entire growth came from customers' premium.
It is a conservative book. Of the debt holdings, 38% is government paper and 57% is AAA rated. The remaining 5% is AA or better. There are no bad assets, and equity is a small slice at about ₹808 crore.
Investment income for the half was ₹425 crore, up 30% from ₹327 crore. The yield was 3.56% for six months, or roughly 7.1% a year. Last year it was 3.71%.
How does that compare? Niva's book is ₹10,488 crore and yields 7.4% a year. Star's is ₹22,491 crore and yields 8.5%, helped by those mark-to-market gains.
So Care's investment engine is bigger than Niva's and earns about the same. The difference between the two is not here. It is in the underwriting line.
Here are Care's key ratios as the company reports them.
Ratio | What it tells you | H1 FY27 | H1 FY26 |
|---|---|---|---|
| Claims ratio (or loss ratio) | Net claims as a share of net earned premium | 75% | 73% |
| Expense ratio | Commission and operating costs as a share of net written premium | 36% | 35% |
| Combined ratio | Claims ratio plus expense ratio. Above 100% is an underwriting loss | 111% | 109% |
| Net retention ratio | Premium kept after reinsurance | 72% | 75% |
| Investment yield (six months) | Income on the investment book | 3.56% | 3.71% |
| Solvency ratio | Capital against the requirement. Minimum is 1.5x | 1.55x | 1.89x |
| Return on net worth (six months) | Profit on shareholders' money | (7%) | 1% |
| Book value per share | Net worth per share | ₹26.11 | ₹26.83 |
These will look different from the percentages earlier in this story. That is because reported ratios use earned premium, after reinsurance, while our tables use GWP. The claims ratio is 75% on the reported basis and 65.9% on GWP.
The direction is what matters. Growth is strong. But the combined ratio has moved further above 100%, and solvency has slipped close to the floor.
For a young, fast-growing insurer, profit is a poor yardstick. It swings with accounting rules, as we just saw. So investors often use a simpler one: how much are you paying for each rupee of premium the company writes?
That is the market cap to GWP ratio.
Care's unlisted share is quoted at an indicative ₹138 on UnlistedZone as of 18 November 2026. That values the company at ₹13,873 crore.
Care Health | Star Health | Niva Bupa | |
|---|---|---|---|
| Market cap (₹ crore) | 13,873 | 32772 | 13711 |
| Annualised GWP (₹ crore) | 12,386 | 19,124 | 9,268 |
| Market cap / GWP | 1.12x | 1.71x | 1.47x |
So at today's price, Care is valued at about 1.12 times the premium it writes in a year. Annualised GWP here is simply first-half GWP multiplied by two.
Until then…
Sources: Care Health Insurance public disclosures for the period ended 30 September 2026; Star Health investor presentation for H1 FY27 (27 October 2026); Niva Bupa investor presentation for H1 FY2027 (4 November 2026); UnlistedZone for Care Health's indicative price and market cap. Figures are in ₹ crore and rounded, so totals may not add exactly.
Disclaimer: This article is for information and education only. It is not investment advice or a recommendation to buy or sell any security. Unlisted shares carry liquidity and valuation risks. Please do your own research or consult a registered adviser before investing.