A) About the Company
As of June 30, 2025, Groww is identified as India's largest and fastest-growing digital investment platform by active users on NSE. Founded in 2016 by four ex-Flipkart employees: Lalit Keshre, Harsh Jain, Ishan Bansal, and Neeraj Singh. They aimed to simplify investing, which they found to be complex and expensive in India.
Core Business: A direct-to-customer digital investment platform offering an app and website for investing in stocks, IPOs, derivatives, bonds, and mutual funds. It follows a technology-first, customer-centric approach.
B) Business Model of Groww Unlisted Shares
Groww’s business model is anchored on two primary drivers:
-
Active Users: Growth is fueled by acquiring new transacting users and retaining existing customers.
-
ARPU (Average Revenue Per User): Increased through:
-
Product Attach: Customers start with one product (e.g., stocks or mutual funds) and gradually adopt more.
-
User Activity: Revenue generation through transactions and Assets Under Management (AUM).
a) Product Adoption (as of June 30, 2025)
-
Only Stocks: 48.4% of users
-
Stocks + 1 other product: 38.3%
-
Stocks + 2 or more products: 13.3%
This indicates that nearly 52% of users diversify beyond stocks, highlighting effective cross-sell and deepening engagement.
b) Revenue Streams of Groww Unlisted Shares
Groww's revenue is primarily derived from five sources:
-
Brokerage & Transaction Fees: From trading in stocks, IPOs, and derivatives.
-
Distribution Fees: Commissions from selling mutual funds and bonds.
-
Margin Trading: Interest income from loans provided for leveraged trades.
-
Personal Loans: Income from lending services.
-
Other Value-Added Services: Revenue from premium features and partner products.
c) User Segments & Growth of Groww Unlisted Shares
-
Aspirational Users: Have assets less than ₹2.5 million, a median age of ~30, and tend to start with small investments, upgrading over time.
-
Affluent Users: Have assets of ₹2.5 million or more, a median age of ~40, and contribute to higher revenue. Their share of total assets grew to 33.18% in June 2025 from 20.34% in FY23.
-
Multi-Product Users: As of June 2025, 5.70 million users used more than one product on the platform.
-
Growth:
-
Active Users: Grew at a CAGR of 52.74% from FY23 to June 2025.
-
Total Customer Assets: Grew at a 91.09% CAGR from FY23 to FY25.
-
Organic Growth: Over 80% of customers are acquired via referrals and word of mouth.
d) Contribution of New Users to Customer Assets
-
FY23: 16.07%
-
FY24: 20.42%
-
FY25: 15.80%
New cohorts continue to add meaningful contributions to total customer assets, showing a strong funnel of fresh investors.
C) Platform Operational KPIs of Groww Unlisted Shares
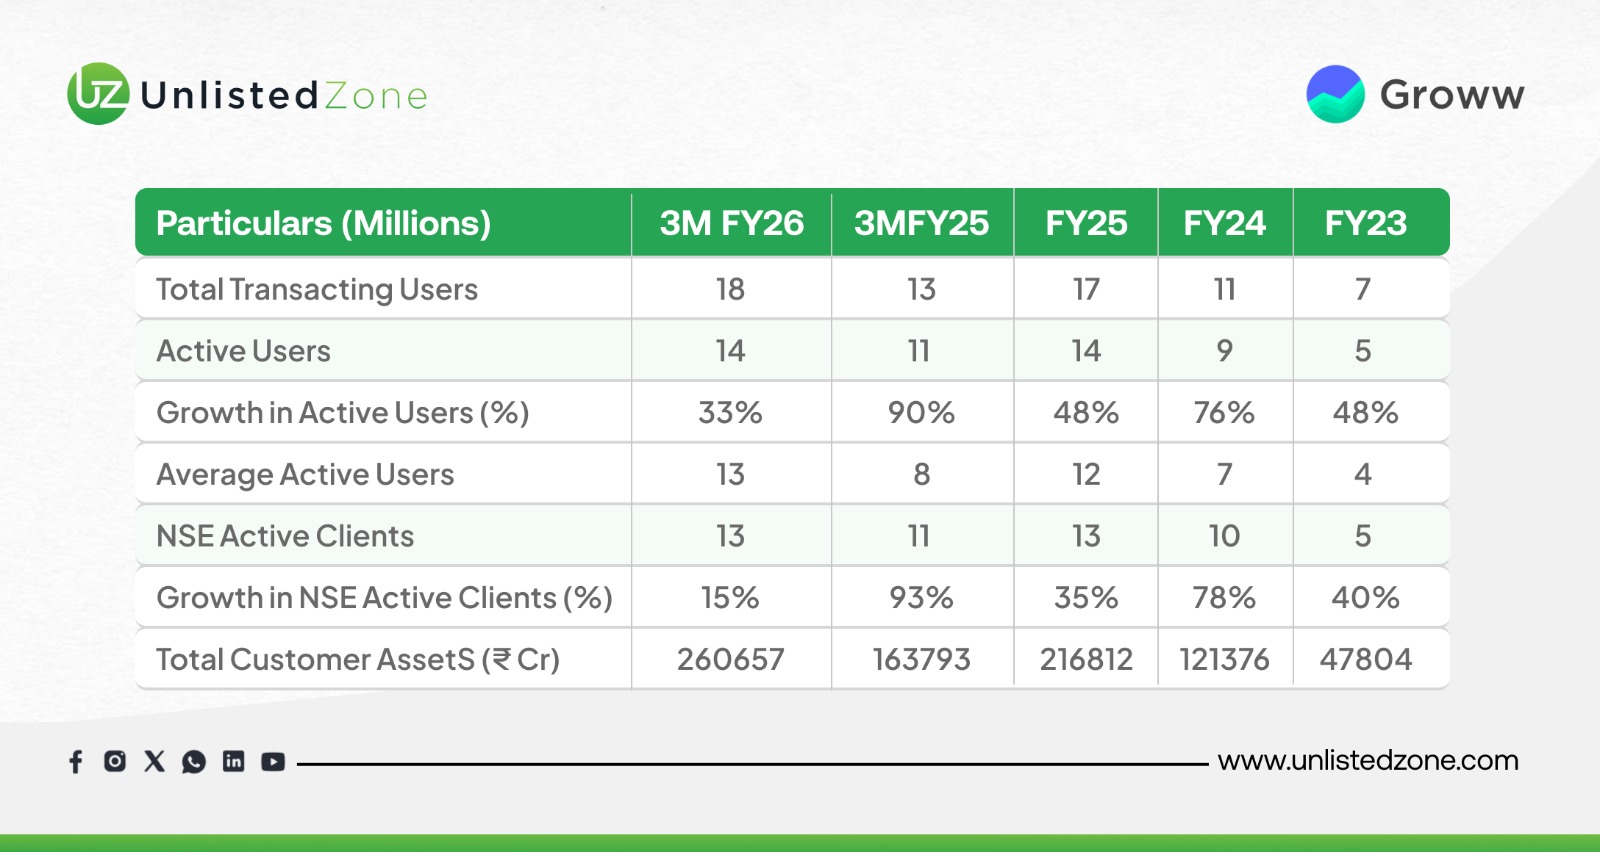
Key Takeaway: Active user base has expanded at a 5-year CAGR of ~48%, while customer assets grew nearly 5.5x between FY23 and FY25.
D) Financial Metrics of Groww Unlisted Shares
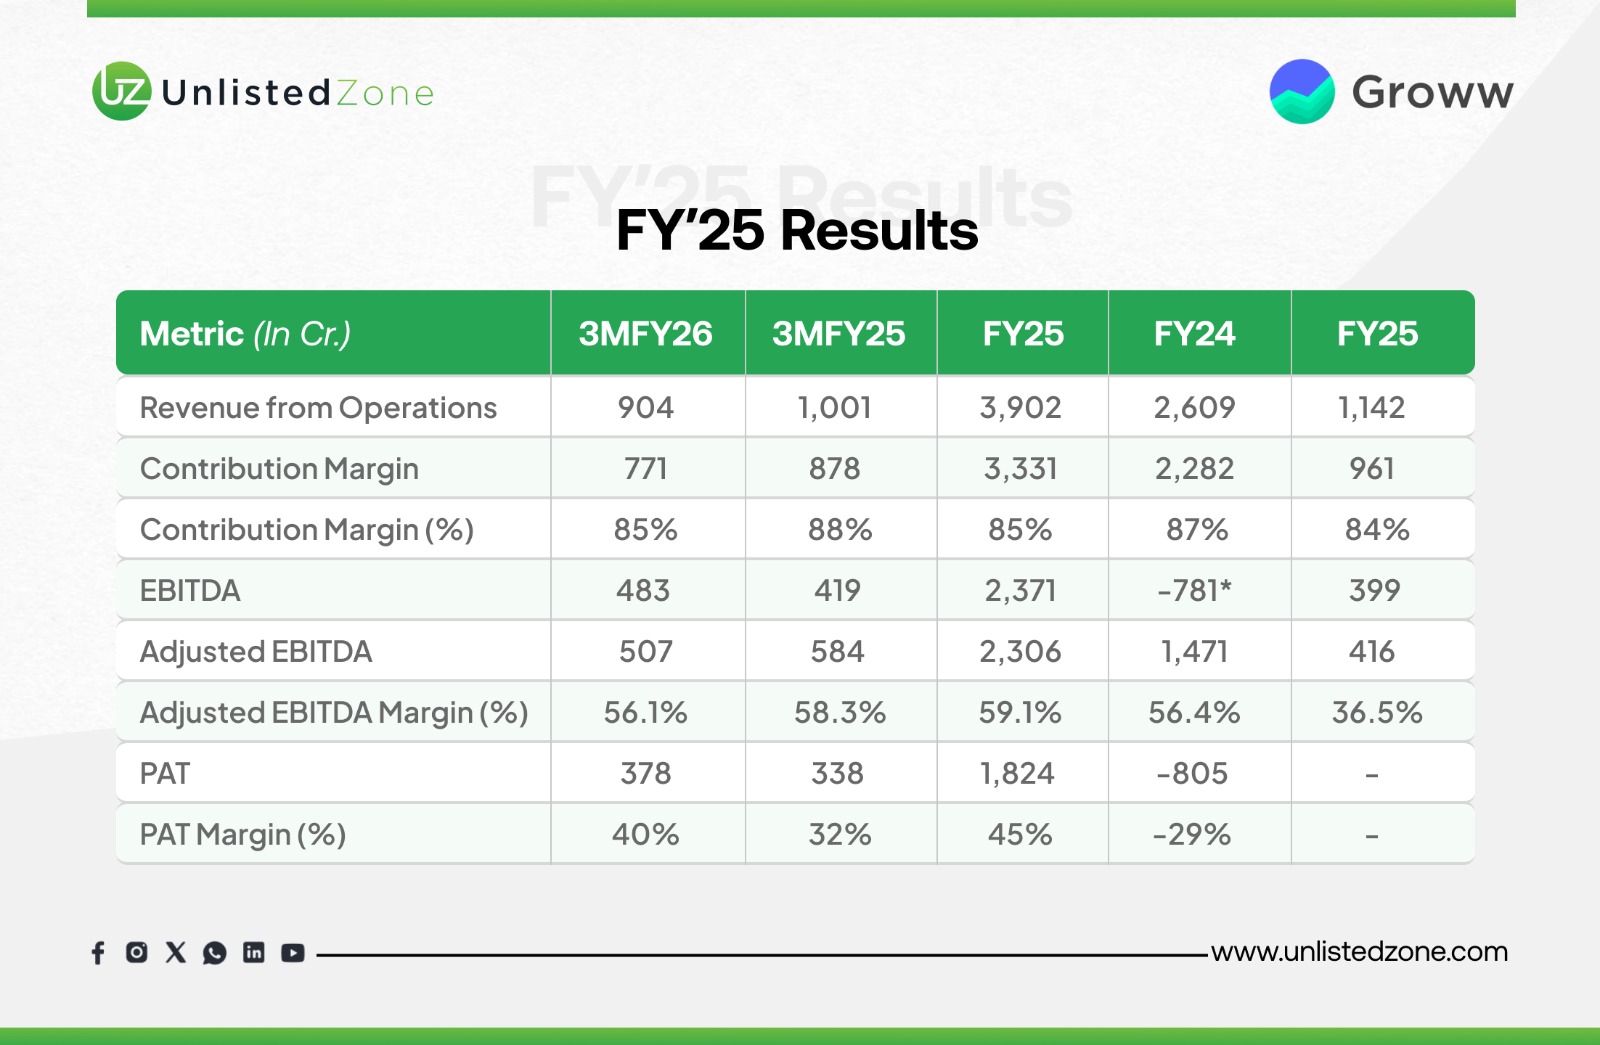
*FY24 EBITDA impacted by ₹1,339.68 Cr exceptional tax liability due to US outbound merger.
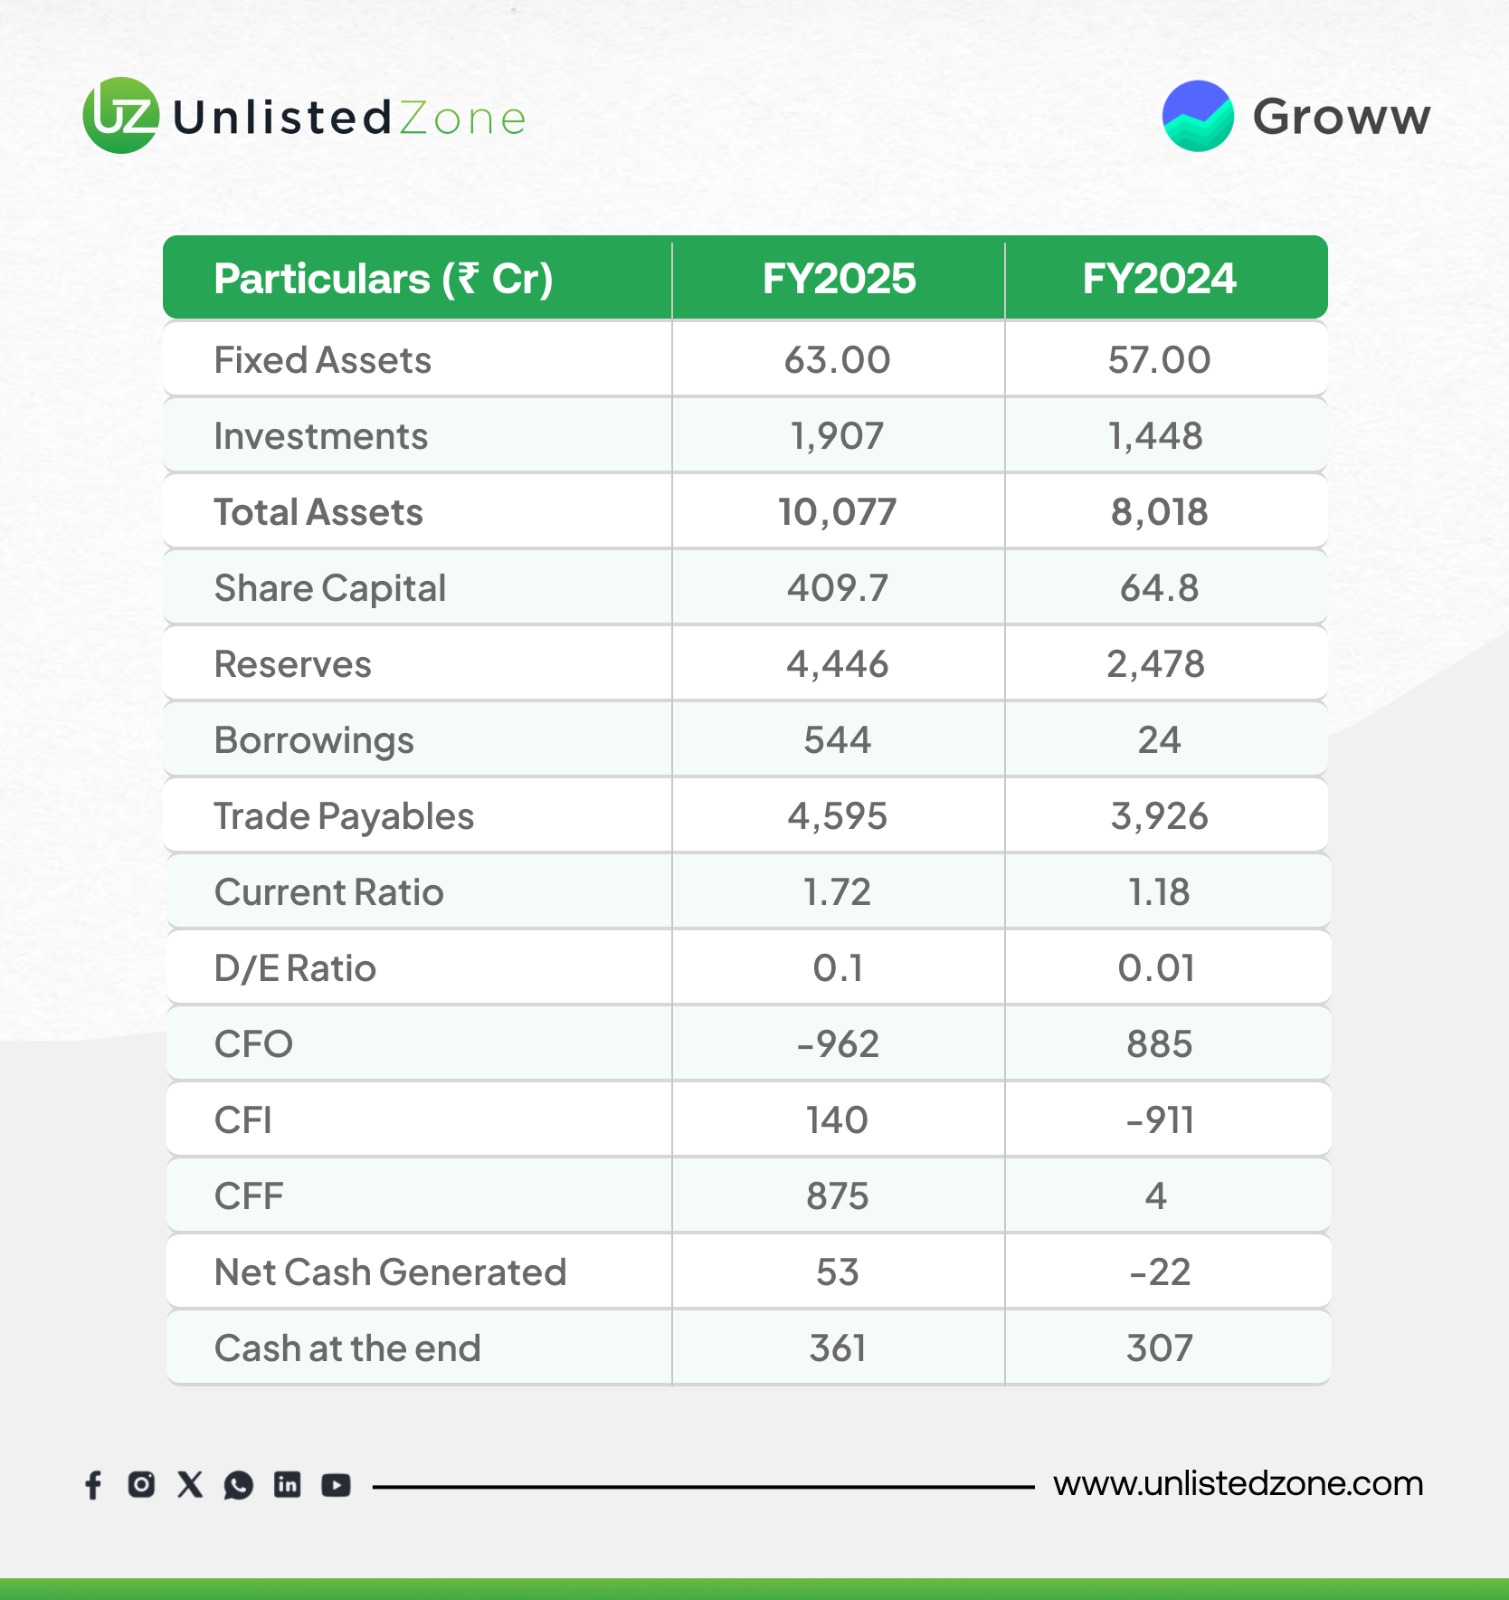
E) Balance sheet Strength and Cash flow Analysis
-
Strength & Growth: The balance sheet shows explosive growth in scale (Total Assets), a massively strengthened equity base (Share Capital + Reserves), and improved short-term liquidity (Current Ratio). The company has grown significantly without taking on excessive debt (Low D/E Ratio).
-
Major Concern: The most critical finding is the severe negative Cash Flow from Operations (CFO). This indicates that although the company is reporting profits (evident from growing reserves), it is not collecting cash from its customers efficiently. This could be due to:
-
Aggressive sales growth leading to high receivables.
-
Large increases in inventory holdings.
-
The nature of long-term projects where revenue is booked before cash is received.
-
Strategy: The company funded its activities and cash shortfall in FY25 primarily by issuing new shares and taking on some debt, rather than from its own operating cash flow.
F) Segment Performance of Groww Unlisted Shares
1. Stocks
-
Active Users: 10.07 Mn in FY25 → 10.28 Mn (Q1 FY26)
-
Average Daily Turnover: ₹9,171.94 Cr in FY25→ ₹10,673.99 Cr (Q1 FY26)
-
Assets: ₹97,640 Cr in FY25 → ₹1,13,997 Cr (Q1 FY26)
2. Derivatives
-
Active Users: Stable at 1.40 Mn
-
Premium Turnover: ₹7,847 Cr in FY25 → ₹9,277 Cr (Q1 FY26)
3. Consumer Credit
-
Partner Disbursements: ₹14,286 Cr in FY25, but only ₹315 Cr in Q1 FY26
-
Groww Creditserv Disbursements: ₹1,261 Cr in FY25 → ₹249 Cr in Q1 FY26
4. Margin Trading Facility (MTF)
5. Mutual Funds
-
Active Users: 8.37 Mn in FY25 → 8.74 Mn (Q1 FY26)
-
Assets: ₹1,13,016 Cr in FY25 → ₹1,39,544 Cr in Q1 FY26
-
SIP Inflows: ₹34,028 Cr in FY25 → ₹10,020 Cr in Q1 FY26
6. Broking Services
AMC (Asset Management Business) of Groww Unlisted Shares
-
Acquired Groww AMC in May 2023
-
First NFO launched Oct 2023
-
As of June 30, 2025: 30 products (11 active funds, 19 passive funds)
-
Active Investors: 0.04 Mn (Jun 2023) → 1.03 Mn (Jun 2025)
-
AUM: ₹7,068 Cr (Mar 2024) → ₹25,199 Cr (Jun 2025)
H) Recent Developments in Groww Unlisted Shares
-
Entered SPAs to acquire Finwizard Technology Pvt. Ltd. for ₹961 Cr (pending approvals)
-
Finwizard business includes: mutual funds distribution, insurance, stock broking, and tax filing services
I) IPO Highlights of Groww Unlisted Shares
Use of Proceeds of Groww IPO
-
Cloud Infrastructure: ₹152.5 Cr
-
Brand & Marketing: ₹225.0 Cr
-
NBFC Capital: ₹205.0 Cr
-
M&A/Acquisitions: ₹117.5 Cr
-
Balance for general corporate purposes
J) Peer Comparison (FY25) of Groww Unlisted Shares
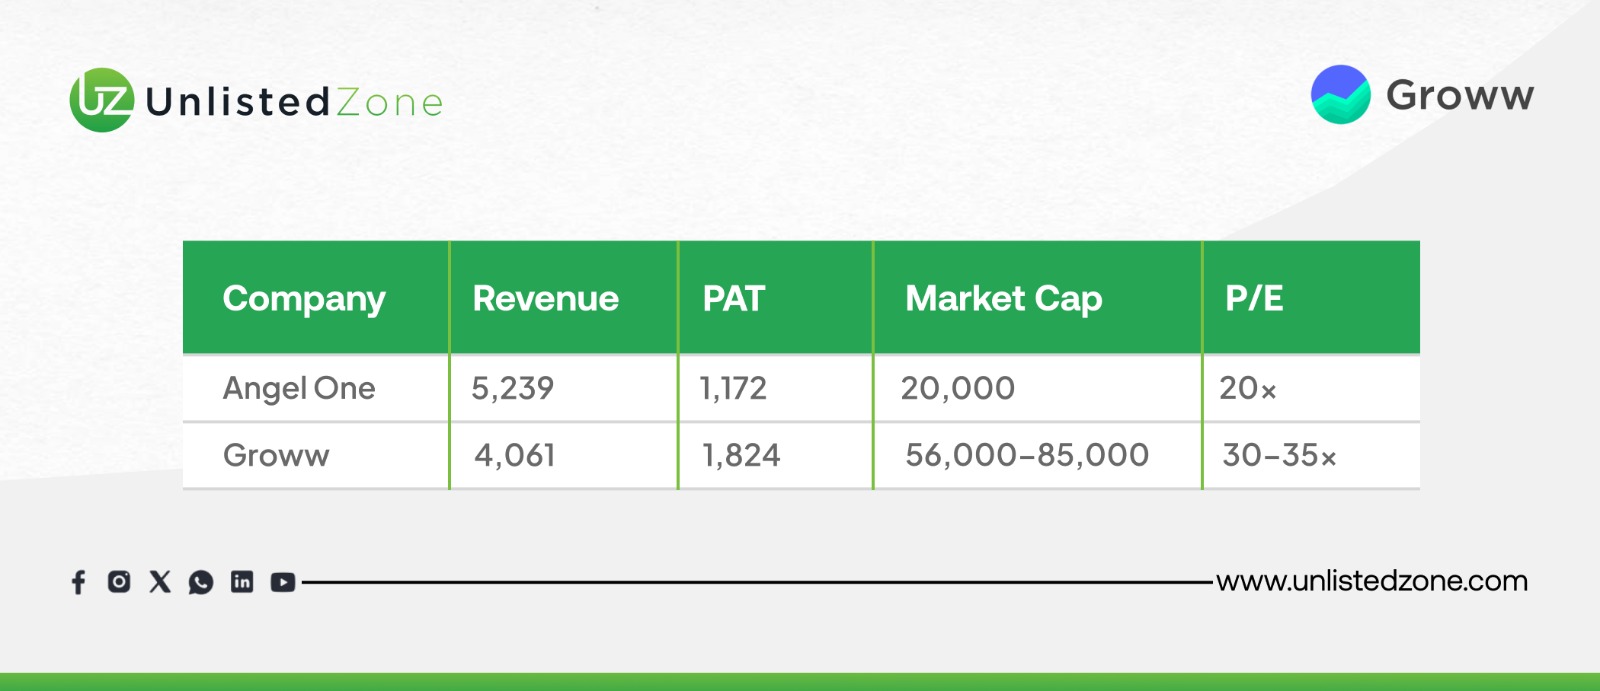
Despite lower revenue than Angel One, Groww commands a premium valuation due to higher profitability, rapid growth, and strong brand equity.
Valuation & Outlook of Groww Unlisted Shares
-
Expected Valuation: ₹60,000–68,000 Cr ($7–8 Bn)
-
Estimated Price/Share: ₹100–114
-
Implied P/E: 33–37x
Core Competitive Strengths of Groww Unlisted Shares
-
Strong Brand Recall: Most searched broker on Google Trends in FY25, with over 80% of customer acquisition being organic.
-
Pan-India Reach: Active users are present across 98% of India's pin codes, with approximately 81% of users from outside the top 6 metro cities.
-
High Engagement: Users spend an average of 65+ minutes daily, with a DAU/MAU ratio of ~56%.
-
Strong Retention: The platform has a 77.7% retention rate over 3 years, which rises to 88.5% for users with two or more products.
-
Market Share Gains: Added 40.08% of new NSE users in Q3 FY25.
Conclusion
Groww’s IPO is underpinned by explosive growth, diversified product adoption, profitability, and scalability. With:
- Strong active user growth (14 Mn+)
- Expanding customer assets (₹2.6 Lakh Cr)
- Profitable business model with 59% EBITDA margins
- Rapidly growing AMC and MTF businesses
It positions itself as a high-growth fintech leader. While valuations appear premium compared to peers, the scale of opportunity in India’s retail investing market justifies the pricing. For investors seeking exposure to India’s fintech growth story, Groww IPO offers a compelling long-term bet.
Disclaimer:
UnlistedZone is not a SEBI-registered Research Analyst or Investment Advisor. All information provided on our platform is strictly for educational and informational purposes. We do not offer investment advice or stock recommendations. Investors are advised to conduct their own due diligence or consult a SEBI-registered advisor. Investments in unlisted and pre-IPO shares are subject to market risks including illiquidity and volatility. UnlistedZone does not assure any returns or accept liability for investment outcomes based on this report.