Reliance General Insurance, one of India’s leading private general insurers, continues to expand its presence across multiple insurance segments, catering to individuals, corporates, and SMEs. Backed by a diverse product portfolio, the company has demonstrated resilience and growth in FY25 despite sectoral challenges.
A) Reliance General Insurance – Financial Performance (FY23–FY25)
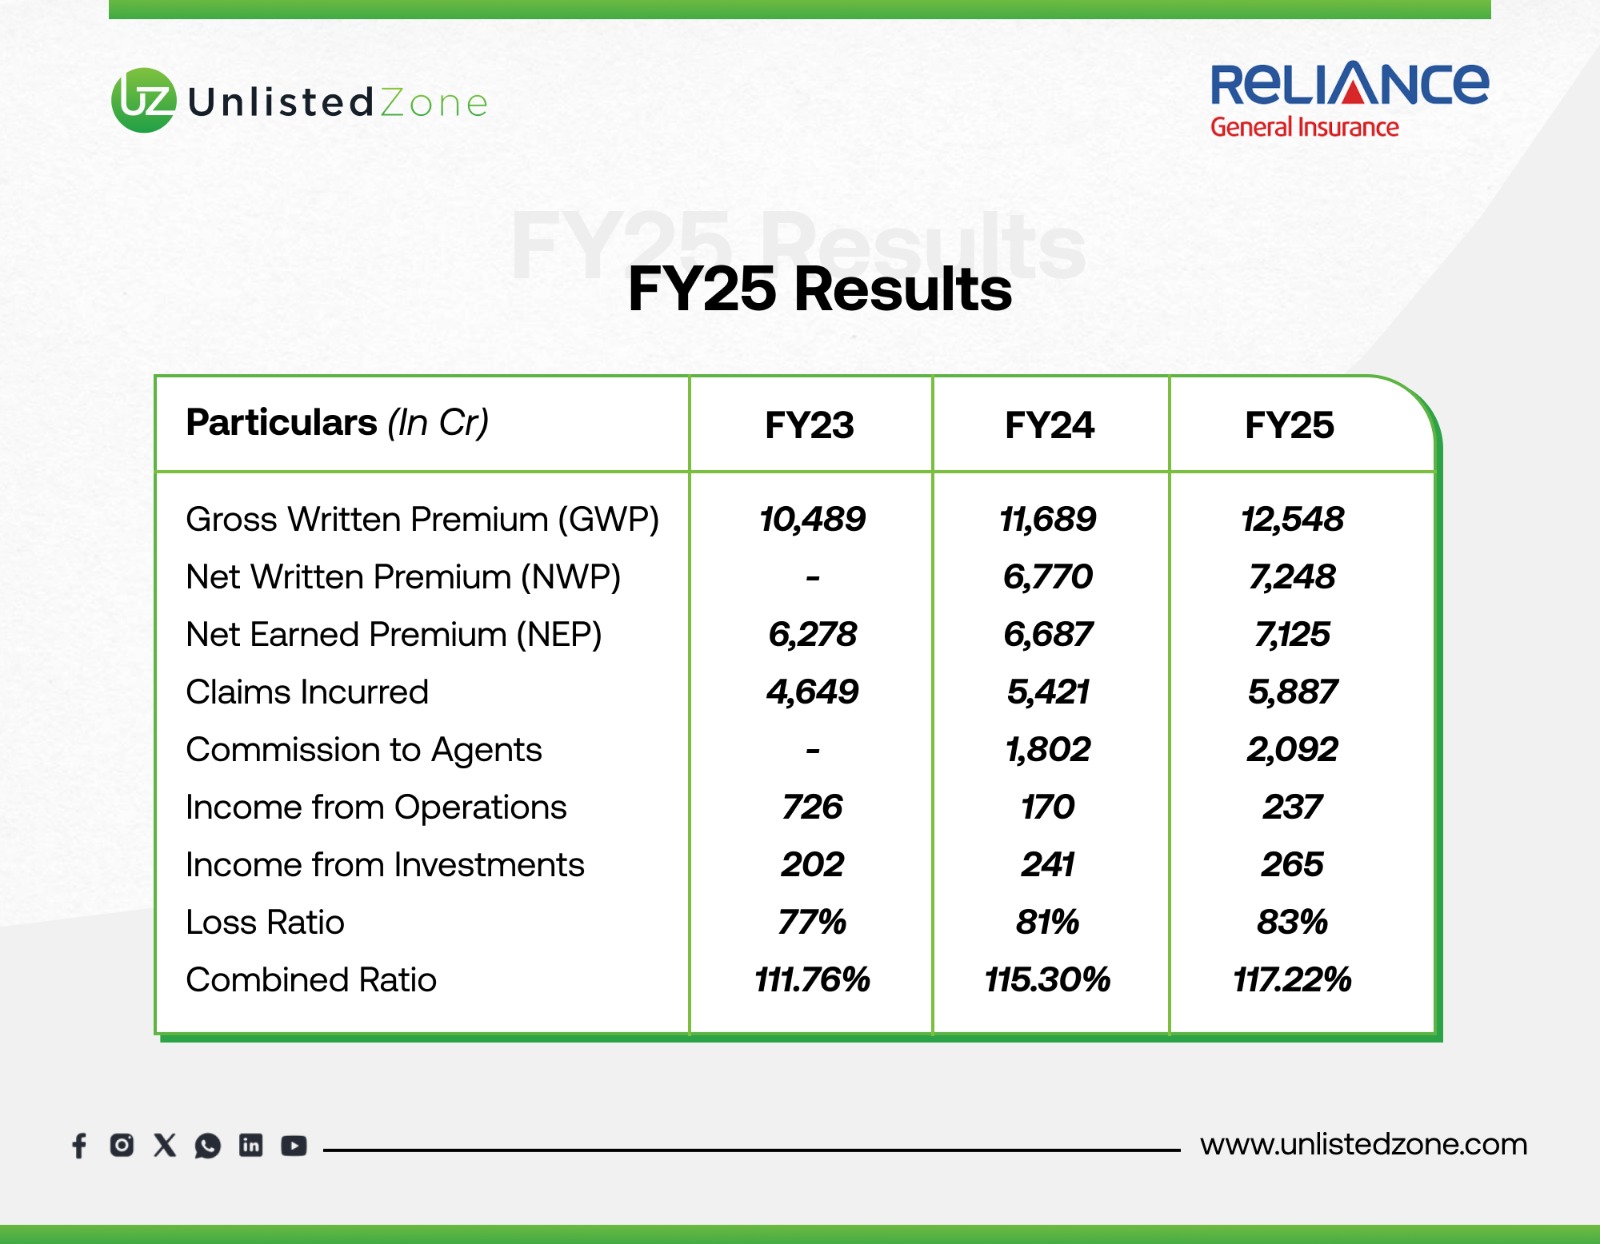
The company’s Gross Written Premium has grown steadily over the three years, crossing ₹12,500 crore in FY25. However, the loss ratio rose to 83% in FY25, indicating higher claims pressure compared to FY24.
B) Reliance General Insurance – FY25 Gross Written Premium (GWP) Contribution by Segment
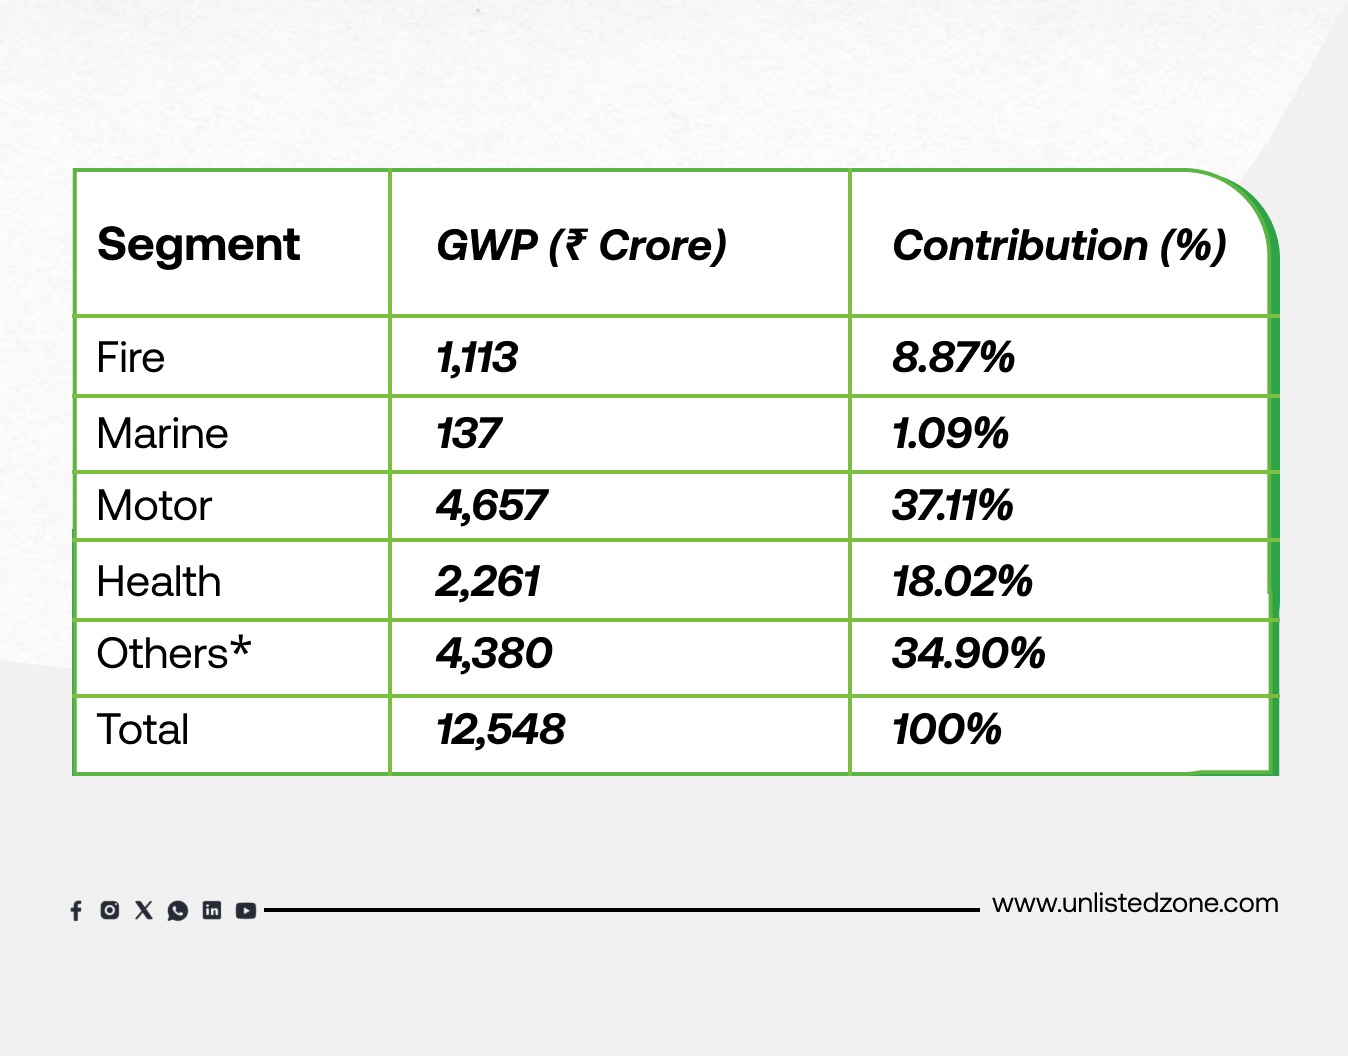
*Others include liability, engineering, shopkeepers’ package, group mediclaim, home, and travel insurance policies.
C) Product-Wise Breakdown & Offerings
1. Motor Insurance – 37.11% GWP Contribution
Reliance General’s motor portfolio remains its largest revenue generator.
-
Car Insurance: Third-party, own damage, and comprehensive coverage with add-ons like Zero Depreciation, Engine Protector, and Roadside Assistance.
-
Two-Wheeler Insurance: Protection against damages, theft, and third-party liabilities.
-
Commercial Vehicle Insurance: Tailored for trucks, buses, cabs, and goods carriers.
2. Health Insurance – 18.02% GWP Contribution
The health insurance segment continues to expand, driven by rising healthcare costs and demand for comprehensive coverage.
-
Retail Health Plans: Health Infinity, Health Gain, and Arogya Sanjeevani.
-
Critical Illness Insurance: Lump-sum payouts for specified illnesses.
-
Super Top-Up Plans: Extended protection beyond base policy limits.
-
Group Mediclaim Policies: Comprehensive coverage for corporates and SMEs.
3. Fire Insurance – 8.87% GWP Contribution
-
Coverage against fire and special perils for offices, factories, warehouses, and residential properties.
-
Decline of ~5% in FY25, aligned with industry-wide slowdown in fire premiums.
4. Marine Insurance – 1.09% GWP Contribution
-
Protection for goods and cargo in transit (air, sea, or road).
-
Growth in FY25 due to increased corporate trade activity.
5. Travel, Home & Other Corporate Insurance – 34.90% GWP Contribution
-
Travel Insurance: International, domestic, student, and senior citizen plans.
-
Home Insurance: Covers structure and contents against natural disasters, burglary, and fire.
-
Liability Insurance: Professional indemnity and directors & officers (D&O) liability cover.
-
Engineering Insurance: Contractor’s All Risk (CAR), Erection All Risk (EAR), and machinery breakdown policies.
-
SME/Shopkeeper Policies: Bundled solutions for small businesses.
D) Financial Ratios & Competitor Benchmarking (FY25)
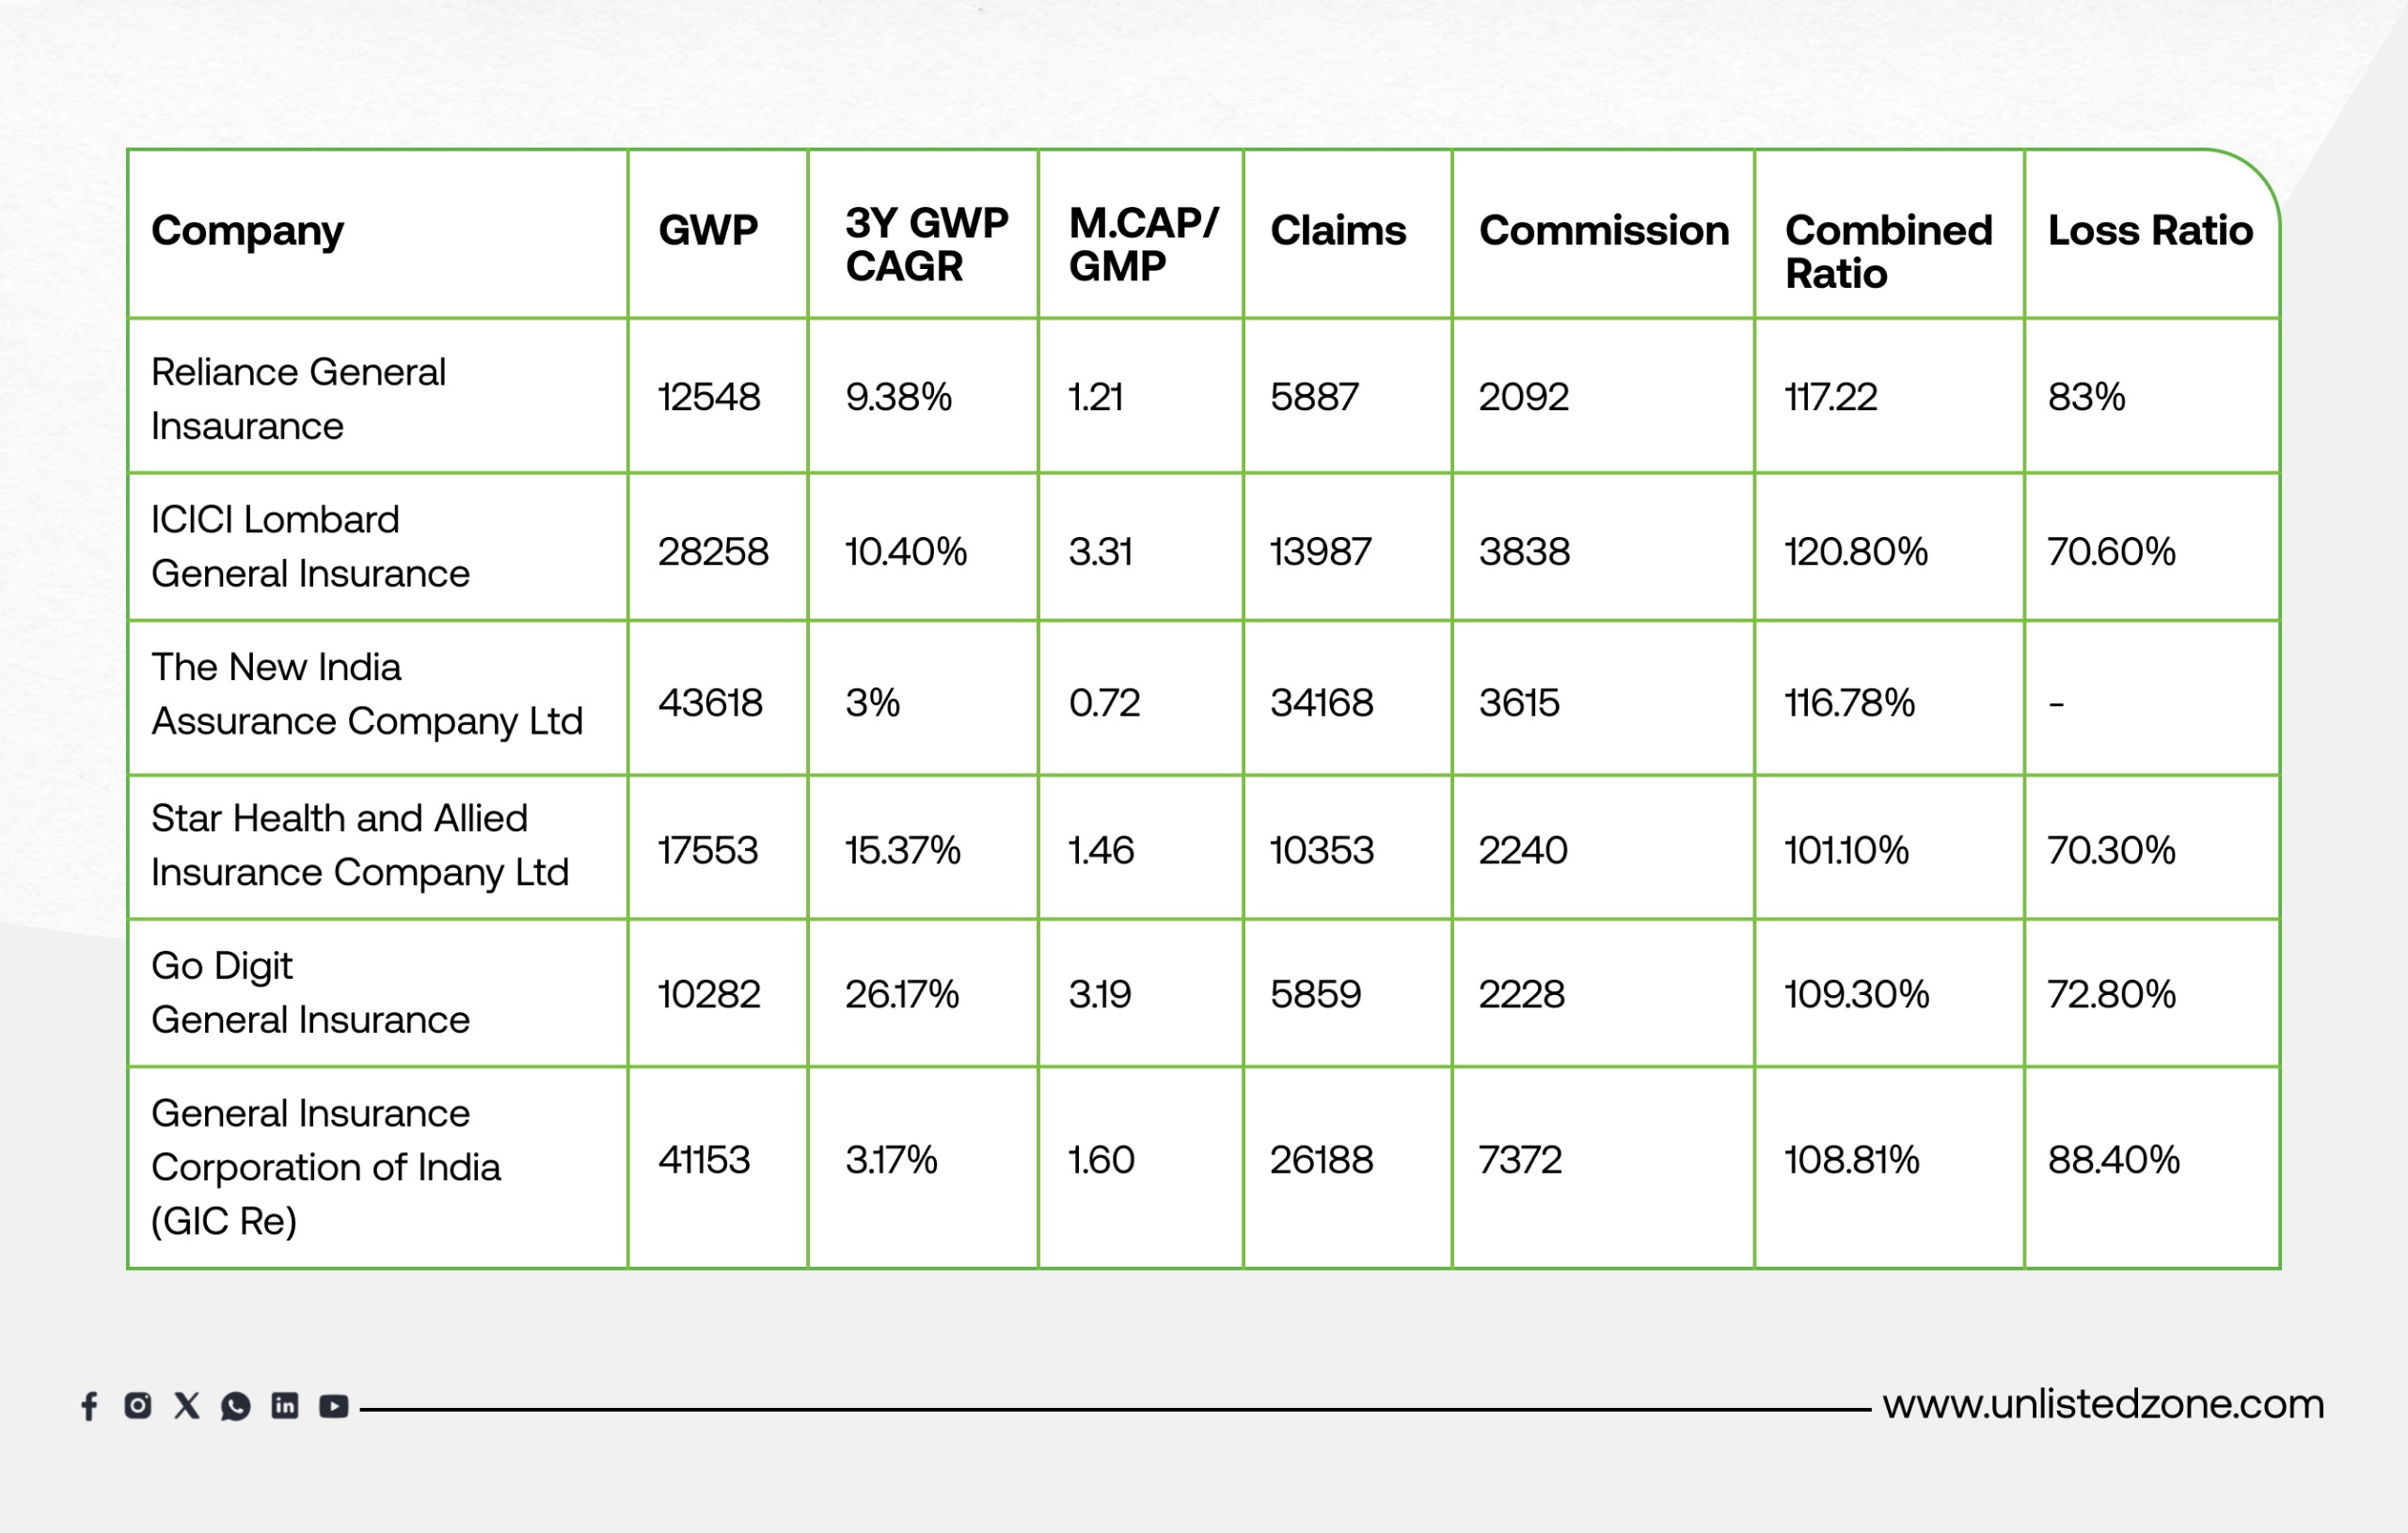
Peer Analysis of General Insurance Companies (FY25)
Reliance General Insurance
-
GWP: ₹12,548 crore, 3Y CAGR: 9.38% → steady but not industry-leading growth.
-
Combined Ratio: 117.22% → indicates underwriting losses; expenses + claims exceed premiums.
-
Loss Ratio: 83% → relatively high, showing large claims burden.
-
Valuation (M.Cap/GWP): 1.21x → fairly priced vs peers, but weaker profitability metrics compared to ICICI Lombard or Go Digit.
ICICI Lombard General Insurance
-
GWP: ₹28,258 crore, 3Y CAGR: 10.40%.
-
Combined Ratio: 120.8% → one of the highest, showing poor underwriting profitability.
-
Loss Ratio: 70.6% → better claims management compared to Reliance, but higher commissions push up combined ratio.
-
Valuation (M.Cap/GWP): 3.31x → premium valuation due to strong brand, scale, and diversified business despite weaker near-term ratios.
The New India Assurance Company Ltd
-
GWP: ₹43,618 crore, 3Y CAGR: 3% → sluggish growth.
-
Combined Ratio: 116.78% → loss-making at the underwriting level.
-
Valuation (M.Cap/GWP): 0.72x → trades at a discount due to PSU nature, low growth, and weaker underwriting efficiency.
Star Health and Allied Insurance
-
GWP: ₹17,553 crore, 3Y CAGR: 15.37% → strong growth, largely from health insurance focus.
-
Combined Ratio: 101.10% → close to breakeven, better underwriting than most peers.
-
Loss Ratio: 70.3% → manageable claims profile.
-
Valuation (M.Cap/GWP): 1.46x → moderate valuation reflecting growth and improving efficiency.
Go Digit General Insurance
-
GWP: ₹10,282 crore, 3Y CAGR: 26.17% → fastest-growing player.
-
Combined Ratio: 109.30% → still loss-making, but relatively better than Reliance or ICICI Lombard.
-
Loss Ratio: 72.8% → efficient compared to Reliance.
-
Valuation (M.Cap/GWP): 3.19x → richly valued, reflecting investor confidence in its tech-driven growth model.
General Insurance Corporation of India (GIC Re)
-
GWP: ₹41,153 crore, 3Y CAGR: 3.17%.
-
Combined Ratio: 108.81% → underwriting losses, but better than ICICI Lombard and Reliance.
-
Loss Ratio: 88.4% → highest claims burden among peers.
-
Valuation (M.Cap/GWP): 1.60x → reasonable given scale, but growth remains muted.
Key Takeaways
-
Growth Leaders:
-
Go Digit (26.17% CAGR) and Star Health (15.37% CAGR) are expanding fastest.
-
Reliance and ICICI Lombard are mid-tier growth.
-
New India Assurance and GIC Re are laggards (~3% CAGR).
-
Profitability (Combined Ratio):
-
Best: Star Health (101.1%) → closest to breakeven.
-
Moderate: Go Digit (109.3%), GIC Re (108.8%).
-
Weak: ICICI Lombard (120.8%), Reliance (117.2%), New India (116.8%).
-
Valuation (M.Cap/GWP):
-
Highest: ICICI Lombard (3.31x) and Go Digit (3.19x), reflecting strong investor confidence.
-
Mid-range: Star Health (1.46x), GIC Re (1.60x).
-
Lowest: New India (0.72x) due to PSU discount.
-
Reliance: 1.21x → trades below Star and Digit due to underwriting weakness.
Conclusion:
-
Reliance General Insurance: Mid-sized player, but weaker underwriting and high loss ratio keep valuations subdued.
-
Best Positioned for Growth: Go Digit (fastest growth, rich valuation) and Star Health (focused niche, near breakeven).
-
Premium Valuation Despite Weakness: ICICI Lombard trades at high multiples due to brand, scale, and investor confidence.
-
PSU Drag: New India and GIC Re suffer from low growth and weak underwriting, hence discounted valuations.
Disclaimer :
UnlistedZone is not a SEBI-registered Research Analyst or Investment Advisor. All information provided on our platform is strictly for educational and informational purposes. We do not offer investment advice or stock recommendations. Investors are advised to conduct their own due diligence or consult a SEBI-registered advisor. Investments in unlisted and pre-IPO shares are subject to market risks including illiquidity and volatility. UnlistedZone does not assure any returns or accept liability for investment outcomes based on this report.